A pandemic recession update in charts
Compared to people who are more affluent, low-income workers are much more vulnerable during a recession. Their jobs are often the first to be cut and they are likely to have limited savings and more debt. Even before the pandemic, a study of financial health in Hawaiʻi found that 69 percent of adult residents were struggling, and the indicators were worse for lower-income households.
In Hawaiʻi, there are signs that the pandemic recession may be especially devastating to the A.L.I.C.E. population (Asset-Limited, Income-Constrained, Employed). Compounding an unprecedented rate of job loss, the pandemic has brought a rise in housing costs—both in the rental and for-sale market—and inflation in food, fuel and consumer goods.
After a year of worry and bad news, Hawaiʻi is again full of tourists. Businesses have reopened, and tax collections are up. However, with the cost of housing and other living expenses also sharply increasing, it remains to be seen if A.L.I.C.E. workers will recover so quickly. The following charts serve to illustrate different elements of economic outlook as Hawaiʻi begins a new fiscal year.
Figure 1. Hawaiʻi Average Monthly Unemployment Filings

Figure 1. Hawaiʻi State Department of Labor and Industrial Relations (DLIR) reports show that after years of low unemployment, Hawaiʻi’s workers filed a monthly average of nearly 70,000 unemployment claims between April 2020 and March 2021.
In some months during that span, Hawaiʻi had triple-digit filings with a high of 123,000 and an unemployment rate of nearly 22 percent. Filings have declined significantly in the second quarter of 2021.
Figure 2. Hawaiʻi Gender Differences in Unemployment

Figure 2. Men typically make up the majority of unemployment claimants. In part, this is due to the project-based employment in the male-dominated construction industry. It was unusual, then, to see that more women than men were unemployed between April 2020 and March 2021. During the pandemic, more service jobs were lost—jobs often held by women—while the construction industry remained strong.
Another contributor to the gender difference is the disproportionate share of childcare responsibilities that fall to women. Closures of daycare centers and schools required more parents to step away from work during the pandemic.
Figure 3. Hawaiʻi Unemployment by Race and Ethnicity

Figure 3. The pandemic recession added to Hawaiʻi’s racial and ethnic income inequity. Compared to their overall representation in the population, Filipinos were much more likely to lose work during the pandemic, and other Pacific Islanders were also disproportionately affected. Native Hawaiians filed for unemployment at higher rates, especially during the most recent quarter.
Figure 4. Change in Number of Hawaiʻi Jobs, June 2021 Compared to January 2020

Figure 4. DLIR job count reports show that the number of jobs in Hawaiʻi dropped from 655,700 in January 2020 to 539,900 in June 2020. Improvements in the economy resulted in an increased job count of 570,500 by June 2021, but this is still 85,200 fewer than in January of 2020.
Although most lost jobs were in the private sector, government employment also lost positions, 7,600 of which were state positions.
Figure 5. Job Losses in Hawaiʻi by Industry, June 2021 Compared to January 2020
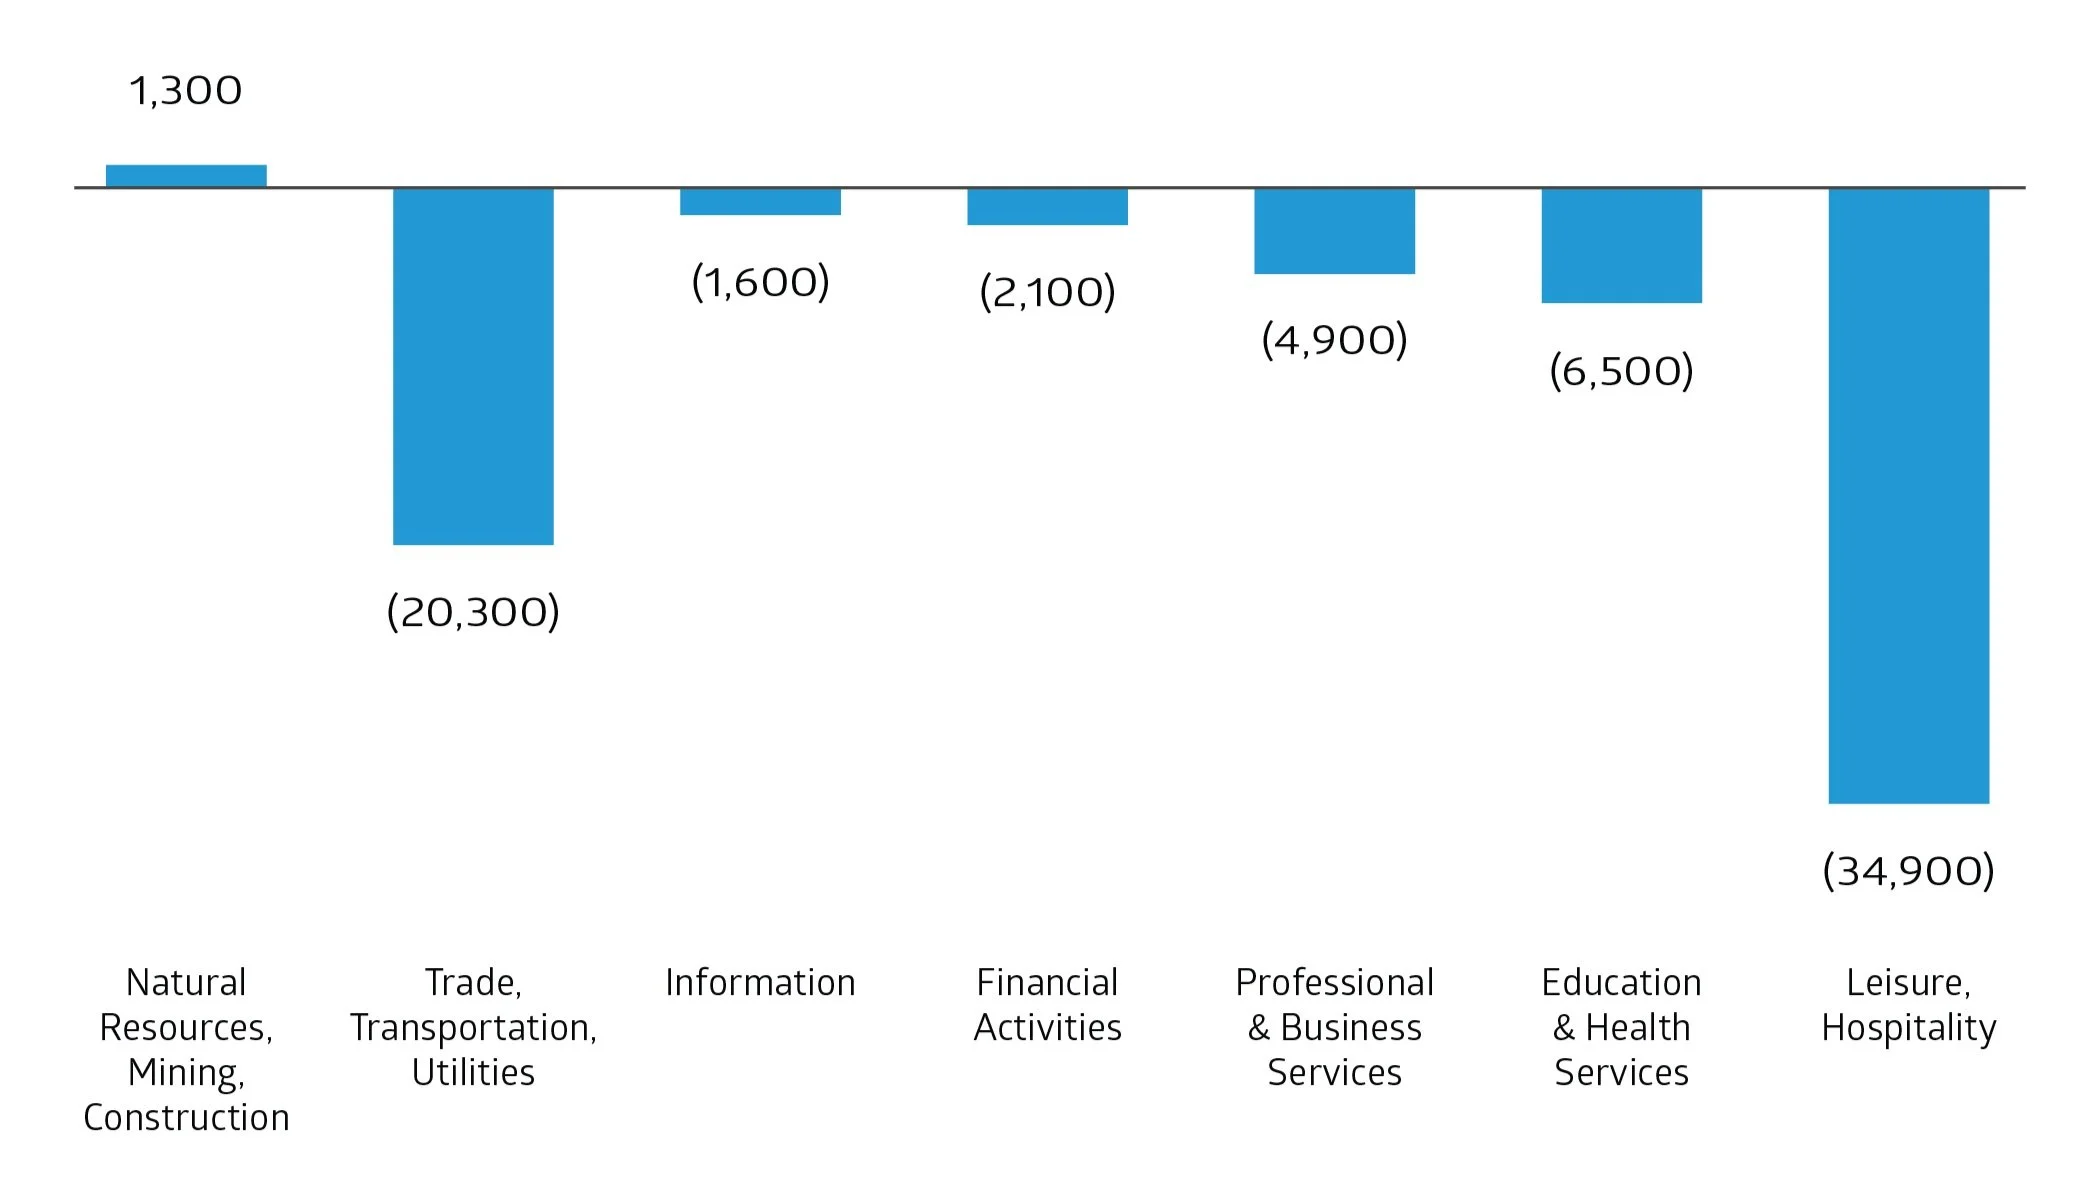
Figure 5. Job losses were greatest in the Leisure and Hospitality sector, where there were nearly 35,000 fewer jobs in June 2021 compared with January 2020. That sector alone accounted for 41 percent of all job losses.
The Trade, Transportation & Utilities sector lost more than 20,000 jobs, with 11,900 coming from retail trade and 7,200 from transportation and warehousing.
The information sector lost only 1,600 jobs, but that was a 16 percent reduction from that sector’s January 2020 job count.
The one sector that made net gains was Natural Resources, Mining & Construction. Within that grouping, Construction of Buildings lost 400 jobs, but Special Trade Contractors increased by 3,300.
Figure 6. Increase in HUD One-Bedroom Fair Market Rents in Hawaiʻi, 2019–2021
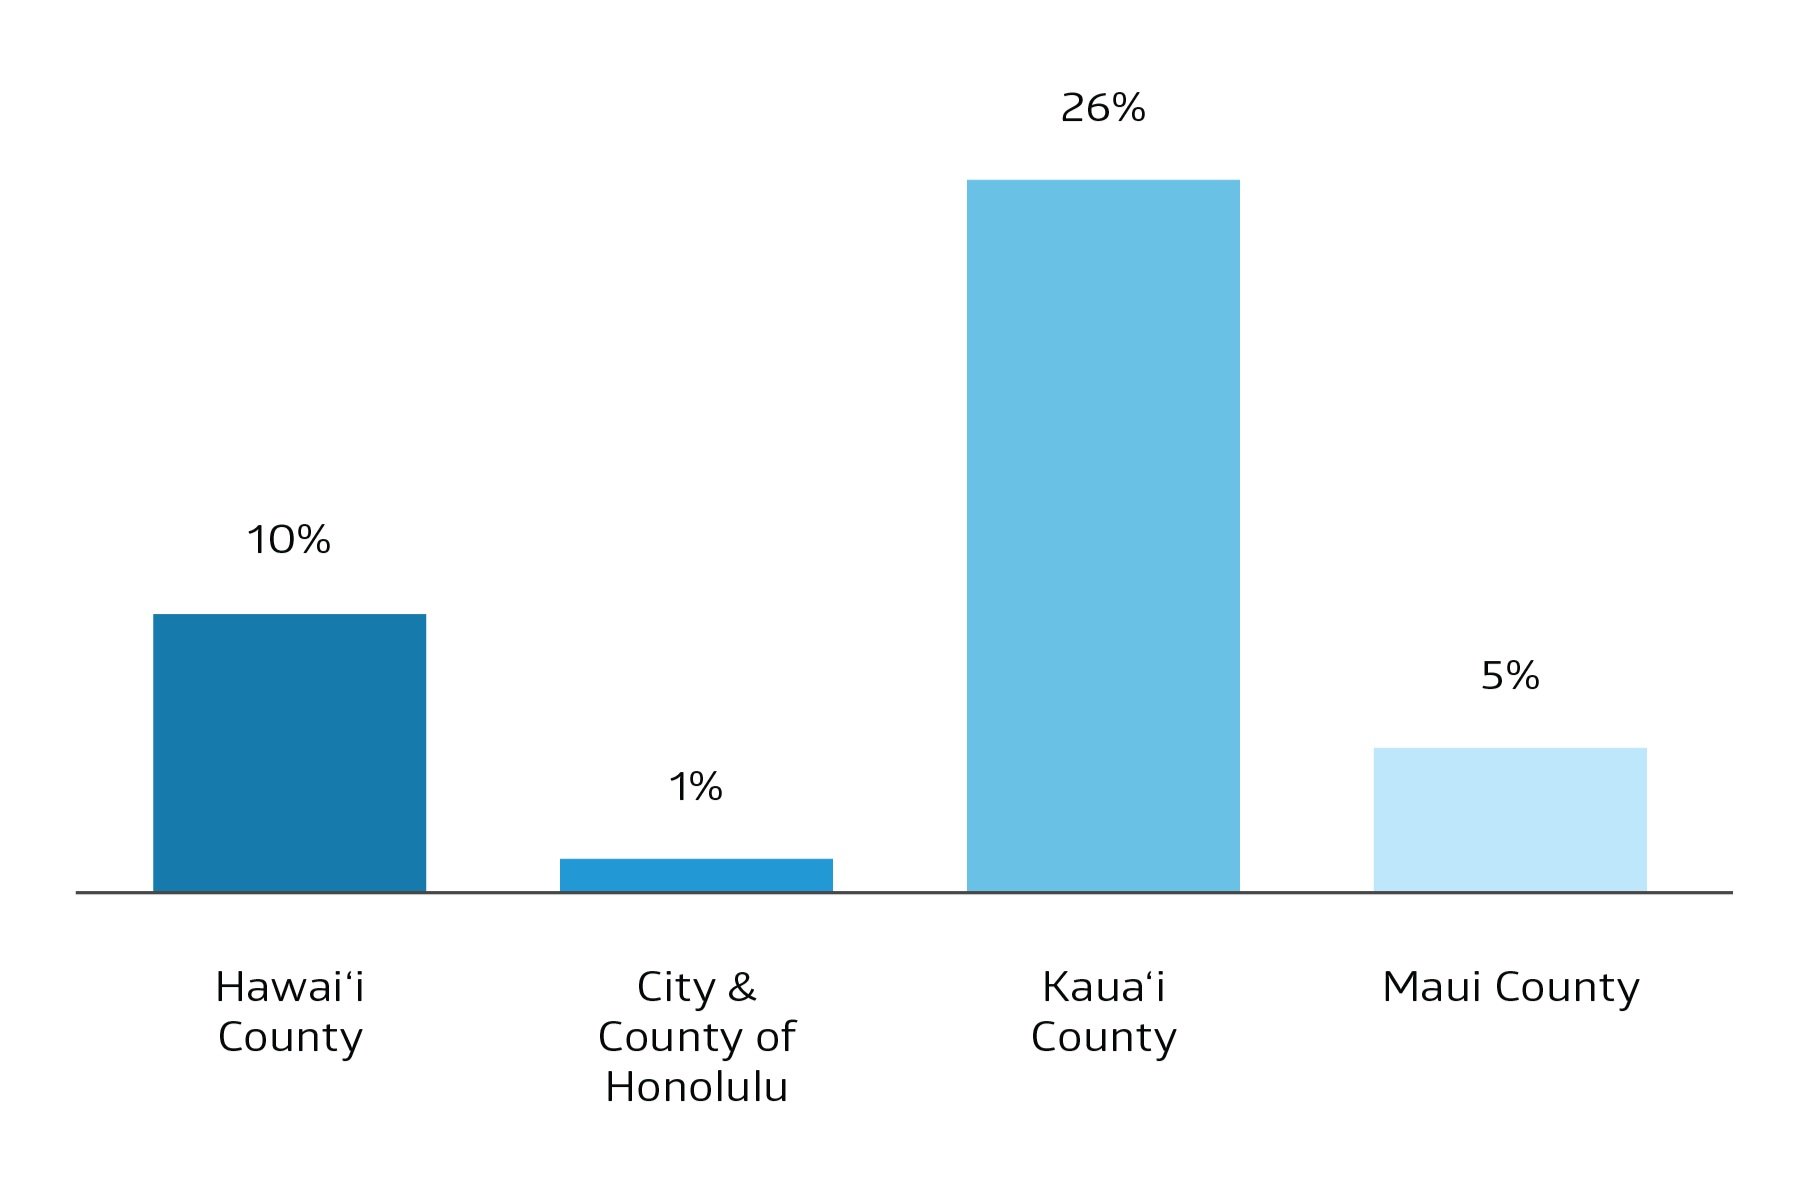
Figure 6. Making the situation so much worse for Hawaiʻi’s low-income workers, the cost of housing grew substantially in some counties between 2019 and 2021, and signs point to more increases ahead. One factor is the planned end to the eviction moratorium on August 6th. Another is greater competition for rental housing.
As reported in Honolulu Civil Beat, more than half the searches for Honolulu apartments are coming from non-residents whose budgets average 10 percent greater than those of local residents. In addition, the cost of purchasing a house has risen so much that some families who might have purchased a home are now competing for rentals.
According to the federal Department of Housing and Urban Development (HUD), between 2019 and 2021 the fair market rent for a one-bedroom apartment increased by only 1 percent in Honolulu County, but rent for the equivalent unit on Kauaʻi increased by 26 percent.
Figure 7. Increase in Media Hawaiʻi Home Sales Prices, 2019–2021

Figure 7. During the same time period, the median sales price for a house grew even more, according to market analysis by Redfin. (Data combines single-family and condominium sales prices.)